The story
In ThreatMark, we are using few database engines, each for a specific purpose
Among them also MySQL fork - MariaDB
Recently we have experienced an issue with one of our systems - our alerting told us that a database stopped responding and
when we investigated the logs,
journalctl -e -u mariadb.service: had a sad message: segmentation fault
We investigated the crash with GDB and found out that:
- An ineffective query was causing semaphores being locked for a long time
- MariaDB has "suicide" code build in purposely shutting down the whole DB engine if a single query hangs for a long time
- There is a bug in the "shutdown code" leading to invalid memory access and subsequent segmentation fault
Below you can find a debugging session of going through mysqld coredump on linux and hunting for query responsible for SIGSEGV recorded step by step
Disclaimer:
- Opinions expressed in this article are my own and do not reflect opinions of my employer
- No customers were impacted by the mentioned system outage
Let's begin
What does it mean for software to crash?
Fortunately, software crashing is not something that happens at random, not something you have to pray not to happen because it's out of your influence, not something happening to you because you bullied your friend in kindergarten, and now karma is paying you back
There are just few reasons and all of them are deterministic
We might have ignored the problem after the first downtime hoping that it will not happen again. We might have tried to reduce the load on the database, hoping it has something to do with "overloading the database" and hoping it will not happen again. We know, that hope is not a strategy and it will happen again, it's just matter of time, therefore we decided to understand
So what was that?
The database have experienced a segmentation fault - to simplify - it was touching memory it should not
and got it's hands slapped
What does it mean?
Our database code (mysqld) was loaded in RAM and CPU happily executed its code in ring3 until it arrived
at ASM instruction doing something which does not make any sense (e.g. copy bytes from a location which does not exist)
During boot, we told CPU, that if something like this ever happens, we would like it to notify the kernel through an interrupt, and that's what happened
If you get excited and your whole body shivers when reading about the things people use every day but have no idea how do they work, this article might be right for your addiction :)
Kernel did not have any option besides killing the task (killing = removing from task list) and telling us through dmesg
Making coredump
Linux kernel has a capability to make a coredump (dump of process's memory) which is automatically triggered in certain cases
In our case, we knew that the process has died both due to SIGSEGV and SIGABRT
Looking at the signal manual
Signal      Standard   Action   Comment

SIGABRT      P1990      Core    Abort signal from abort(3)
SIGSEGV      P1990      Core    Invalid memory reference)
We see that both signals will produce a coredump. As these two signals seem to happen "somehow at the same time" for the same process, we don't want the coredump to be overwritten. Let's make sure that each time there will be a different corefile by configuring /proc/sys/kernel/core_pattern
We can use something like coredump_%E-%t-%s where %s the signal ID
Bring out the big weapons, it's GDB time !
In order to debug coredump, you need same version of the binary and all shared libraries (.so files), otherwise the addresses will not match
You can replicate the environment with docker, virtual machine or any other way
We of course had the image, because we have a deterministic build process in place using packer
Then, you need debug symbols installed In our case, we used red-hat based system and had the same repository mirror configured, so it was just
1 | |
Let's run the gdb and display traceback, e.g. with where command
gdb /usr/bin/mysqld ./core.
(gdb) where
#0  my_read (Filedes=7025,
    Buffer=0x7fa873de8c60 "Limit", ' ' <repeats 21 times>, "Soft Limit", ' ' <repeats 11 times>, "Hard Limit", ' ' <repeats 11 times>, "Units     \nMax cpu time", ' ' <repeats 14 times>, "unlimited", ' ' <repeats 12 times>, "unlimited", ' ' <repeats 12 times>, "seconds   \nMax file size", ' ' <repeats 13 times>, "unlimited       "..., Count=4096, MyFlags=<optimized out>)
    at /usr/src/debug/MariaDB-10.2.40/src_0/mysys/my_read.c:63
#1  0x0000561b46213d6d in output_core_info ()
    at /usr/src/debug/MariaDB-10.2.40/src_0/sql/signal_handler.cc:71
#2  0x0000561b46214160 in handle_fatal_signal (sig=6)
    at /usr/src/debug/MariaDB-10.2.40/src_0/sql/signal_handler.cc:351
#3  <signal handler called>
#4  0x00007fd906683387 in raise () from /lib64/libc.so.6
#5  0x00007fd906684a78 in abort () from /lib64/libc.so.6
#6  0x0000561b46508873 in ib::fatal::~fatal (this=0x7fa873deac00, __in_chrg=<optimized out>)
    at /usr/src/debug/MariaDB-10.2.40/src_0/storage/innobase/ut/ut0ut.cc:649
#7  0x0000561b464b8002 in srv_error_monitor_thread ()
    at /usr/src/debug/MariaDB-10.2.40/src_0/storage/innobase/srv/srv0srv.cc:1891
#8  0x00007fd9083abea5 in start_thread () from /lib64/libpthread.so.0
#9  0x00007fd90674b9fd in clone () from /lib64/libc.so.6
So there is a thread, which runs srv_error_monitor_thread(frame 7) function, then for some reason code calls abort()(frame 5), which results into a SIGABRT and finally it ended up with a SIGSEGV
Let's start from the crash, getting bigger picture as we go through the stack
Signal handling
After 'something' happens (we will look WHY after we understand this), abort() is called, SIGABRT signal emited, which is handled in signal_handler.cc#L71
Let's display the code around our line with list GDB command:
(gdb) frame 1
#1  0x0000561b46213d6d in output_core_info ()
    at /usr/src/debug/MariaDB-10.2.40/src_0/sql/signal_handler.cc:71
71      while ((len= my_read(fd, (uchar*)buff, sizeof(buff),  MYF(0))) > 0)
(gdb) list /usr/src/debug/MariaDB-10.2.40/src_0/sql/signal_handler.cc:60,80
60    char buff[PATH_MAX];
61    ssize_t len;
62    int fd;
63    if ((len= readlink("/proc/self/cwd", buff, sizeof(buff))) >= 0)
64    {
65      my_safe_printf_stderr("Writing a core file...\nWorking directory at %.*s\n",
66                            (int) len, buff);
67    }
68    if ((fd= my_open("/proc/self/limits", O_RDONLY, MYF(0))) >= 0)
69    {
70      my_safe_printf_stderr("Resource Limits:\n");
71      while ((len= my_read(fd, (uchar*)buff, sizeof(buff),  MYF(0))) > 0)
72      {
73        my_write_stderr(buff, len);
74      }
75      my_close(fd, MYF(0));
76    }
The code is reading some linux pseudofiles to be written to log to make investigation easier
It calls some function (deeply named as my_read) when reading /proc/self/limits (line 71), which leads to crash
Reading /proc/self/limits through my_read
This magical function is in my_read.c#L63 and looks like this
(gdb) frame 0
#0  my_read (Filedes=7025,
    Buffer=0x7fa873de8c60 "Limit", ' ' <repeats 21 times>, "Soft Limit", ' ' <repeats 11 times>, "Hard Limit", ' ' <repeats 11 times>, "Units     \nMax cpu time", ' ' <repeats 14 times>, "unlimited", ' ' <repeats 12 times>, "unlimited", ' ' <repeats 12 times>, "seconds   \nMax file size", ' ' <repeats 13 times>, "unlimited       "..., Count=4096, MyFlags=<optimized out>)
    at /usr/src/debug/MariaDB-10.2.40/src_0/mysys/my_read.c:63
63        int got_errno= my_errno= errno;
(gdb) list mysys/my_read.c:36,64
36  size_t my_read(File Filedes, uchar *Buffer, size_t Count, myf MyFlags)
37  {
38    size_t readbytes, save_count= 0;
39    DBUG_ENTER("my_read");
40    DBUG_PRINT("my",("fd: %d  Buffer: %p  Count: %lu  MyFlags: %lu",
41                     Filedes, Buffer, (ulong) Count, MyFlags));
42    if (!(MyFlags & (MY_WME | MY_FAE | MY_FNABP)))
43      MyFlags|= my_global_flags;
44
45    for (;;)
46    {
47      errno= 0;                                   /* Linux, Windows don't reset this on EOF/success */
48  #ifdef _WIN32
49      readbytes= my_win_read(Filedes, Buffer, Count);
50  #else
51      readbytes= read(Filedes, Buffer, Count);
52  #endif
53      DBUG_EXECUTE_IF ("simulate_file_read_error",
54                       {
55                         errno= ENOSPC;
56                         readbytes= (size_t) -1;
57                         DBUG_SET("-d,simulate_file_read_error");
58                         DBUG_SET("-d,simulate_my_b_fill_error");
59                       });
60
61      if (readbytes != Count)
62      {
63        int got_errno= my_errno= errno;
64        DBUG_PRINT("warning",("Read only %d bytes off %lu from %d, errno: %d",
The problematic line is the assignement on line 63
63 int got_errno= my_errno= errno;
One CPU executes this line, it's sad and emits SIGSEGV signal, kernel shuts down the process and makes coredump
What can be wrong with assigment ? How can assignment lead to a segfault ?
Either we try to read something we can't or we want to write somewhere we cant
So.. What are the variables ?
(gdb) p errno
$1 = 0
(gdb) p got_errno
$2 = <optimized out>
Hmm optimized away...
The code was complied with some optimization flags (take a look at this for details how GCC does that)
Sorry, we have to go deeper again
C code will not tell us what's happening here because it's not directly translated to ASM because of optimizations
We have to go deeper :)
Let's think about it
- We have a coredump at time of the crash, this includes registers
- The program crashed when CPU tried to execute last instruction
- Last instruction is stored in IP register, also called Program Counter
- The register points to memory (mapped .text section of elf file)
- Format of data on that address is OPCode of instruction (this is what sillicon actually can read) - if you are masochist, read this
GDB can show any piece of memory with x command, i flag makes it understand the bytes as instructions (translate OPCode to human text) and the address we care about is $pc, so x/i $pc is the command
(gdb) x/i $pc
=> 0x561b46776fc6 <my_read+390>:    mov    %ecx,(%rax)
It's AT&T syntax telling, that we should take value of ECX register and move it to address stored in RAX register
So what's in those registers ?
(gdb) info registers
rax            0x0  0
rbx            0x0  0
rcx            0x0  0
So we are trying to copy value 0 to memory at address zero... This explains the segfault !
Where did we get the value rax ? In general, that's where output value of a function call is stored in x64 architecture
Let's look at surrounding instructions with x/10i $pc-10
(gdb) x/10i $pc-10
   0x561b46776fbc <my_read+380>:    callq  0x561b46778840 <_my_thread_var>
   0x561b46776fc1 <my_read+385>:    mov    (%r14),%ecx
   0x561b46776fc4 <my_read+388>:    test   %ecx,%ecx
=> 0x561b46776fc6 <my_read+390>:    mov    %ecx,(%rax)
   0x561b46776fc8 <my_read+392>:    je     0x561b467770c0 <my_read+640>
   0x561b46776fce <my_read+398>:    cmp    $0xffffffffffffffff,%r13
   0x561b46776fd2 <my_read+402>:    je     0x561b46776fe0 <my_read+416>
   0x561b46776fd4 <my_read+404>:    test   %r13,%r13
   0x561b46776fd7 <my_read+407>:    jne    0x561b467770da <my_read+666>
   0x561b46776fdd <my_read+413>:    nopl   (%rax)
We care about output of rax - result of a function call
Last function call is to 0x561b46778840 (callq)..... what is that ?
Let's display the code (list) at the address -> list *0x561b46778840
(gdb) list *0x561b46778840
0x561b46778840 is in _my_thread_var (/usr/src/debug/MariaDB-10.2.40/src_0/mysys/my_thr_init.c:393).
388     free(tmp);
389   }
390 }
391
392 struct st_my_thread_var *_my_thread_var(void)
393 {
394   return  my_pthread_getspecific(struct st_my_thread_var*,THR_KEY_mysys);
395 }
396
397 int set_mysys_var(struct st_my_thread_var *mysys_var)
The value of my_errno is determined by return value of pthread_getspecific
If we take a look at pthread_getspecific
- The signature is
void *.. it returns a pointer user should better check it's not zero - Documentation says " A call to pthread_getspecific() for the thread-specific data key being destroyed shall return the value NULL"
How would such code checking for NULL look like ?
test $rax,$rax
Do you see it in here ? I don't !
   0x561b46776fbc <my_read+380>:    callq  0x561b46778840 <_my_thread_var>
   0x561b46776fc1 <my_read+385>:    mov    (%r14),%ecx
   0x561b46776fc4 <my_read+388>:    test   %ecx,%ecx
=> 0x561b46776fc6 <my_read+390>:    mov    %ecx,(%rax)
It seems like a lack of defensive programming - author just counts with blue sky scenario
we found a bug in MariaDB !
It seems like it's some race condition where the thread variable gets destroyed
Because the bug is only triggered when the database is going down anyway (in our case because of SIGABRT), we didn't investigate further
I remain however curious what exactly are the conditions of this race condition. If you plan to go through the dry-aged spaghetti code, please write me
and I will for sure update the article :)
Moving up from rabbit hole
So...
- Some-one called SIGABRT
- output_core_info () was called
- This resulted into crash (we tried to read de-initialized thread variable)
Let's see why we called abort() in the first place
Abort is called in srv_error_monitor_thread which is looking for a few nasty things which might happen over the runtime of MySQL
The code is from 1995 and with some of the checks, and some pieces specifically does not make me very confident that anyone understands all the pieces 🙂
But don't worry, no judgement here - every monolithic system converges to dry-aged spaghetti
1 2 3 4 5 6 7 8 9 10 11 12 13 14 15 | |
Code which concerns us is on lines 1870-1895 (list /usr/src/debug/MariaDB-10.2.40/src_0/storage/innobase/srv/srv0srv.cc:1870,1895)
(gdb) frame 7
#7  0x0000561b464b8002 in srv_error_monitor_thread ()
    at /usr/src/debug/MariaDB-10.2.40/src_0/storage/innobase/srv/srv0srv.cc:1891
1891                ib::fatal() << "Semaphore wait has lasted > "
(gdb) list /usr/src/debug/MariaDB-10.2.40/src_0/storage/innobase/srv/srv0srv.cc:1870,1895
1870        /* Update the statistics collected for deciding LRU
1871        eviction policy. */
1872        buf_LRU_stat_update();
1873
1874        if (sync_array_print_long_waits(&waiter, &sema)
1875            && sema == old_sema && os_thread_eq(waiter, old_waiter)) {
1876    #if defined(WITH_WSREP) && defined(WITH_INNODB_DISALLOW_WRITES)
1877          if (os_event_is_set(srv_allow_writes_event)) {
1878    #endif /* WITH_WSREP */
1879            fatal_cnt++;
1880    #if defined(WITH_WSREP) && defined(WITH_INNODB_DISALLOW_WRITES)
1881          } else {
1882            fprintf(stderr,
1883                "WSREP: avoiding InnoDB self crash due to long "
1884                "semaphore wait of  > %lu seconds\n"
1885                "Server is processing SST donor operation, "
1886                "fatal_cnt now: " ULINTPF,
1887                srv_fatal_semaphore_wait_threshold, fatal_cnt);
1888          }
1889    #endif /* WITH_WSREP */
1890            if (fatal_cnt > 10) {
1891                ib::fatal() << "Semaphore wait has lasted > "
1892                    << srv_fatal_semaphore_wait_threshold
1893                    << " seconds. We intentionally crash the"
1894                    " server because it appears to be hung.";
1895            }
It basically means:
- Check threads which are waiting for semaphors in infinite loop
- If the oldest (waiting for the longest time) thread waits for same semaphor for 10 iterations, it's bad
The code arrives at conclusion, that if something like that happens, only way out is samurai harakiri abort(2)
Whats the query what causes all of that ?
On the lines 1874 we can see some clues
1874        if (sync_array_print_long_waits(&waiter, &sema)
1875            && sema == old_sema && os_thread_eq(waiter, old_waiter)) {
Let's go to frame 7 (that's the command) to read those
Best would be to just read thread ID from waiter variable
(gdb) print &waiter
$6 = (os_thread_id_t *) 0x7fa873deabe0
Issue is that we cannot translate this thread to threadID in GDB... take a look at this StackOverflow answer
Let's try to find that, which is waiting for the semaphor instead:
(gdb) p sema
$7 = (const void *) 0x7fcb0ab23070
So we are looking for a thread in something like waiting for 0x7fcb0ab23070
Let's ask all those threads what they are doing
gdb --batch --eval-command="thread apply all bt full" /usr/bin/mysqd ./core > full_bt.txt
Seeems like thread 5656
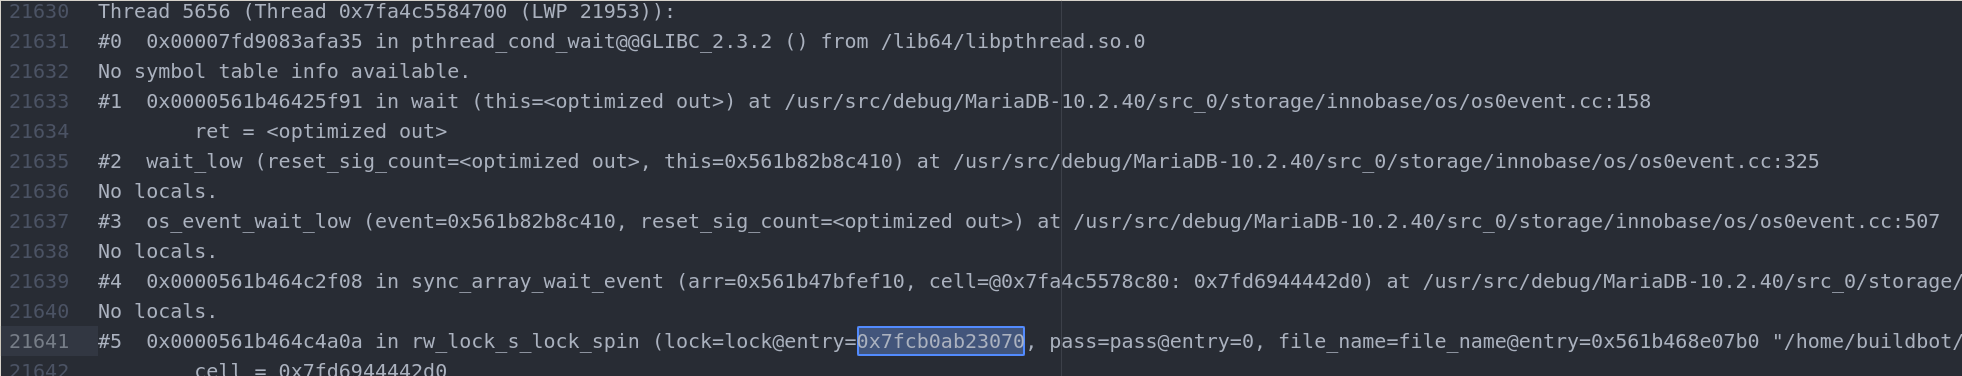
Let's switch thread with thread 5656 command and display traceback with where
Gotcha !
(gdb) where
#0  0x00007fd9083afa35 in pthread_cond_wait@@GLIBC_2.3.2 () from /lib64/libpthread.so.0
#28 0x0000561b46084306 in mysql_parse (thd=thd@entry=0x7fa68437dc38, rawbuf=<optimized out>,
    length=<optimized out>, parser_state=parser_state@entry=0x7fa4c55834d0,
    is_com_multi=is_com_multi@entry=false, is_next_command=is_next_command@entry=false)
    at /usr/src/debug/MariaDB-10.2.40/src_0/sql/sql_parse.cc:7793
#29 0x0000561b460858b2 in dispatch_command (command=command@entry=COM_QUERY,
    thd=thd@entry=0x7fa68437dc38,
    packet=packet@entry=0x7fa6842a4229 "(SELECT c"..., packet_length=packet_length@entry=605,
    is_com_multi=is_com_multi@entry=false, is_next_command=is_next_command@entry=false)
    at /usr/src/debug/MariaDB-10.2.40/src_0/sql/sql_parse.cc:1828
#30 0x0000561b460876ea in do_command (thd=0x7fa68437dc38)
    at /usr/src/debug/MariaDB-10.2.40/src_0/sql/sql_parse.cc:1382
#31 0x0000561b461535f6 in do_handle_one_connection (connect=connect@entry=0x561c356e7708)
    at /usr/src/debug/MariaDB-10.2.40/src_0/sql/sql_connect.cc:1336
#32 0x0000561b4615370d in handle_one_connection (arg=arg@entry=0x561c356e7708)
    at /usr/src/debug/MariaDB-10.2.40/src_0/sql/sql_connect.cc:1241
#33 0x0000561b4673124d in pfs_spawn_thread (arg=0x561c34df2c78)
    at /usr/src/debug/MariaDB-10.2.40/src_0/storage/perfschema/pfs.cc:1869
#34 0x00007fd9083abea5 in start_thread () from /lib64/libpthread.so.0
#35 0x00007fd90674b9fd in clone () from /lib64/libc.so.6
We can print the full query for example from frame 29 and packet variable
Simple p command will show only part of the query, however we can execute printf - printf "%s", packet
(gdb) frame 29
#29 0x0000561b460858b2 in dispatch_command (command=command@entry=COM_QUERY
(gdb) printf "%s", packet
(SELECT <redacted>
After the query was identified, it was obvious why it's causing the locking and we were able to mitigate the issue
Conclusion
This story has semi-positive outcome
We identified the offensive query and changed part of the system not to trigger the bug
We have a plan to move this system to a different type of database better suitable for the requirements we have on it and this is yet another reason
These two hours of reading source codes and debugging made the picture of MariaDB suffer even more as a robust and reliable database in my eyes
If you read so far, I would like to thank you
If you found any issues in this post, or if you understand deeper nature of this bug, please let me know!
Motivation: If something does not work as expected, go deeper and ask why :)